Transforms
Omniview uses Transforms to change an objects properties at run-time. Transforms are similar to Animations used in other SCADA or HMI projects. The key difference is that a transform can apply the result of an arbitrary Python expression to to nearly any property. This results in high degree of flexibility and a low count of primitive graphical objects.
An example of this is the Omniview TextBlock object can combines the functionality of static text, numeric displays and string displays in one object by using a Text transform and standard Python string building functions.
It should be noted that all examples shown below have been created directly inside a view in the example project. Objects like these that are complex and are likely to be reused should be made into a Template object. See Templates for details.
The scripts used in these examples have been hardcoded to demonstrate the transforms. It is good practice to write general purpose functions that maximize code reuse.
Transform Properties
| Property | Note |
|---|---|
| Default | The default value if the Source expression fails to evaluate or doesn't return any value. |
| Enabled | Enables the transform. When disabled the transform will not be executed. |
| Property | The name of the target property that will be modified by the transform. |
| Quality | Read only, not used from a template or view. The quality of any tags used in the expression combined to give an overall quality. |
| Source | A Python expression that will be mapped to the target property. The source expression will be evaluated every screen update. |
| TransformType |
|
| Value | When TransformType is Map, the Value is a dictionary that will map the result returned by the Source expression to a value. |
Note: Templated objects can be used to pass instance specific object parameters to the source expression. See Templates for details.
Relative Binding
Relative binding exposes the context of the expression execution as python variable 'self'. Relative binding is used in transforms to allow the Source expression access to the calling objects properties.
{
    "property":"Text",
    "source": "'{},{},{}'.format(self.Name,self.X,self.Y)"
}
The ViewObject Custom property has been added to facilitate attaching custom values to objects.
Examples
Toggle Button
The example below shows a two state button. When the button is pressed, a variable will be changed. The Text and Fill properties will be set based on the value of the target variable.
In this example, the function ExampleTwoStateButton() is used as the event handler when the loft mouse button is clicked. This function toggles a variable, which is then mapped to a button color and button text. The Text property and the Fill property are mapped to different values using a Map type transform, which uses the value returned from the Source expression to get the corresponding value from the dictionary stored in the Value property.
View:
{
    "$type":"Button",
    "X": 10,
    "Y": 50,
    "MouseLeftButtonDownExpression": "ExampleTwoStateButton()",
    "Height":"60",
    "Width":"200",
    "Text":"False",
    "Fill":"#FF0000",
    "BorderThickness": 2,
    "transforms":[
        {
            "property":"Fill",
            "type":"Map",
            "source":"GetButtonState()",
            "value": {
                "True": "#00FF00",
                "False":"#FF0000"
            }
        },
        {
            "property":"Text",
            "transformType":"Map",
            "source":"GetButtonState()",
            "value": {
                "True": "True",
                "False":"False"
            }
        }
    ]
}
Script:
from Omniview.Python import *

buttonVar = False

def ExampleTwoStateButton():
    global buttonVar
    buttonVar = not buttonVar

def GetButtonState():
    return(buttonVar)


Numeric Display
The example below shows a numeric display that will show a time that is set by a user (not shown). A transform is applied to the Text property of a TextBlock object. The Source property calls a user made function that will return the formatted string with the formatted numbers and some text. See https://docs.python.org/2.7/library/string.html for string formatting documentation.
View:
{
    "$type": "TextBlock",
    "Name": "NumericDisplay",
    "Height": "30",
    "Width": "300",
    "FontSize": "12",
    "X": "10",
    "Y": "180",
    "Text": "",
    "BorderThickness": 2,
    "TextAlignment": "Middle,Center",
    "Border": "#000000",
    "Padding": "5",
    "transforms": [
        {
            "property": "Text",
            "source": "GetExampleVarString()"
        }
    ]
}
Script:
def GetExampleVarString():
    global numericVar
    global numericVar2
    return "Set Time (MM:SS): {:02d}:{:02d}".format(numericVar,numericVar2)


Bar Graph
The example below shows a simple bar graph object. This object uses three transforms: The height of the bar, the position of the bar, and the color of the bar.
A separate transform for size and position is required when the bar is is moving from bottom to top or from right to left, as the reference corner of the object will also move. Only the size is required when the bar is moving from top to bottom or from left to right.
The script shown below uses the same variables used by the Numeric Display.
View:
{
    "$type": "Group",
    "Name": "BarGraph",
    "X": "20",
    "Y": "300",
    "Children": [
        {
            "$type": "Rectangle",
            "Name": "BarGraphOutside",
            "Height": "200",
            "Width": "25",
            "X": "0",
            "Y": "0",
            "BorderThickness": "2",
            "BorderColor": "#000000",
            "Fill": "#C0C0C0"
        },
        {
            "$type": "Rectangle",
            "Name": "BarGraphFill",
            "Height": "200",
            "Width": "25",
            "X": "0",
            "Y": "0",
            "Fill": "#00FF00",
            "transforms": [
                {
                    "property": "Height",
                    "source": "ScaleBarGraphHeight(MinY = 0.0, MaxY = 200.0, MinVal = 0.0, MaxVal = 60.0)"
                },
                {
                    "property": "Y",
                    "source": "ScaleBarGraphPosition(0.0, MinY = 0.0, MaxY = 200.0, MinVal = 0.0, MaxVal = 60.0)"
                },
                {
                    "property": "Fill",
                    "source": "GetBarGraphColor()"
                }
            ]
        }
    ]
}
Script:
def ScaleBarGraphHeight(MinY = 0, MaxY = 100, MinVal = 0, MaxVal = 60):
    global numericVar
    global numericVar2
    barGraphVar = ((1.0/60.0) * numericVar2) + numericVar
    return barGraphVar*(MaxY - MinY)/(MaxVal - MinVal)


def ScaleBarGraphPosition(BarY, MinY = 0, MaxY = 100, MinVal = 0, MaxVal = 60):
    global numericVar
    global numericVar2
    barGraphVar = ((1.0/60.0) * numericVar2) + numericVar
    return (BarY + MaxY) -  barGraphVar*(MaxY - MinY)/(MaxVal - MinVal)


def GetBarGraphColor():
    global numericVar
    global numericVar2

    startColor = [0xFF,0x00,0x00] # Red
    endColor = [0x00,0xFF,0x00] # Green
    resultColor = [0x00,0x00,0x00]

    colorVar = (((1.0/60.0) * numericVar2) + numericVar)/60.0

    for idx,color, in enumerate(startColor):
        resultColor[idx] = (endColor[idx] * math.sin(colorVar*0.5*pi)) + (startColor[idx] * math.sin((1 - colorVar)*0.5*pi))

    return "#{:02X}{:02X}{:02X}".format(int(resultColor[0]),int(resultColor[1]),int(resultColor[2]))
 |
 |
 |
 |
|---|
Radial Bar Graph
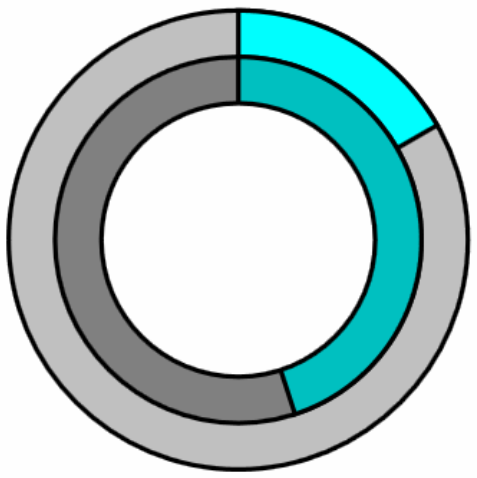
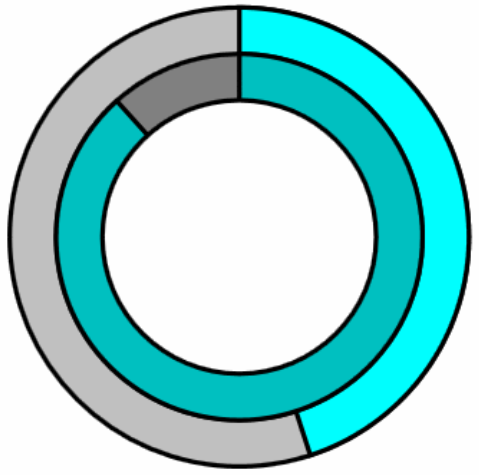
The example below shows a more complex radial bar graph with two bars. This will be carried over into the templating example.
A radial bar graph can be constructed using overlapping wedges. However, Omniview does not currently support a Wedge object. A polygon with a path that traces the outline of can be used, with a transform being applied to the path to dynamically alter it. The script for creating the path is shown below.
View:
{
    "$type": "Group",
    "Name": "CircleGraph",
    "X": "400",
    "Y": "100",
    "Children": [
        {
            // This ellipse is the background for the outer ring.
            "$type":"Ellipse",
            "Name":"Ellipse1",
            "Height":200,
            "Width":200,
            "X":"0",
            "Y":"0",
            "BorderColor":"#000000",
            "BorderThickness":2,
            "Fill": "#C0C0C0"
        },
        {
            // This polygon is the outer bar.
            // The path traces out a wedge, with the tip covered by the other objects.
            "$type":"Polygon",
            "Name":"Polygon1",
            "Path": "100,100",
            "Fill":"#00FFFF",
            "Thickness":"2",
            "X":"100",
            "Y":"100",
            "transforms":[
                {
                    "property": "Path",
                    "source": "ExampleCirclePlot(198)"
                }
            ]
        },
        {
            // Background for the middle ring
            "$type":"Ellipse",
            "Name":"Ellipse2",
            "Height":160,
            "Width":160,
            "X":"20",
            "Y":"20",
            "BorderColor":"#000000",
            "BorderThickness":2,
            "Fill": "#808080"
        },
        {
            // Inner bar
            "$type":"Polygon",
            "Name":"Polygon2",
            "Path": "100,100",
            "Fill":"#00C0C0",
            "Thickness":"2",
            "X":"100",
            "Y":"100",
            "transforms":[
                {
                    "property": "Path",
                    "source": "ExampleCirclePlot2(158)"
                }
            ]
        },
        {
            // Inner ring that covers the other objects.
            "$type":"Ellipse",
            "Name":"Ellipse3",
            "Height":120,
            "Width":120,
            "X":"40",
            "Y":"40",
            "BorderColor":"#000000",
            "BorderThickness":2,
            "Fill": "#FFFFFF"
        }
    ]
}
Script:
# Example function for the outer bar
def ExampleCirclePlot(diameter):
    global numericVar

    # 0 is straight up
    startAngle = 0

    # End angle is the current value scaled by the maximum value, converted to radians.
    endAngle = (float(numericVar)/60.0) *(2.0*pi)

    # Gets the wedge shaped path
    path = CreateWedge(diameter,startAngle,endAngle)

    # Makes the path start and end in the center of the circle (0,0)
    path = "0.0,0.0,"+path+",0.0,0.0"

    return path


# Example function for the inner bar
def ExampleCirclePlot2(diameter):
    global numericVar2
    startAngle = 0
    endAngle = (float(numericVar2)/60.0) *(2.0*pi)

    path = CreateWedge(diameter,startAngle,endAngle)
    path = "0.0,0.0,"+path+",0.0,0.0"

    return path


'''
Returns a path for a wedge shape
'''
def CreateWedge(diameter,startAngle,endAngle):
    numberOfPoints = 100

    angleList = CircleLinspace(startAngle,endAngle,numberOfPoints)
    xPoints = []
    yPoints = []

    for angle in angleList:
        y = -math.cos(angle)
        x = math.sin(angle)

        xPoints.append(x)
        yPoints.append(y)

    points = []
    for i in range(len(xPoints)):
        points.append("{:.2f},{:.2f}".format(xPoints[i] * (diameter/2), yPoints[i] * (diameter/2)))

    return ",".join(points)


'''
Evenly spaces points between the start and end angle in radians
Always moves clockwise
Returns a list of angles
'''
def CircleLinspace(start,end,count):
    if count < 2: return None

    if end <= start:
        end += 2*math.pi

    step = (end-start)/(count - 1)
    points = [start]

    i = 1
    while i < count:
            currentPoint = (points[i-1] + step)% (2*math.pi)
            points.append(currentPoint)
            i += 1

    return points

