TrendChart
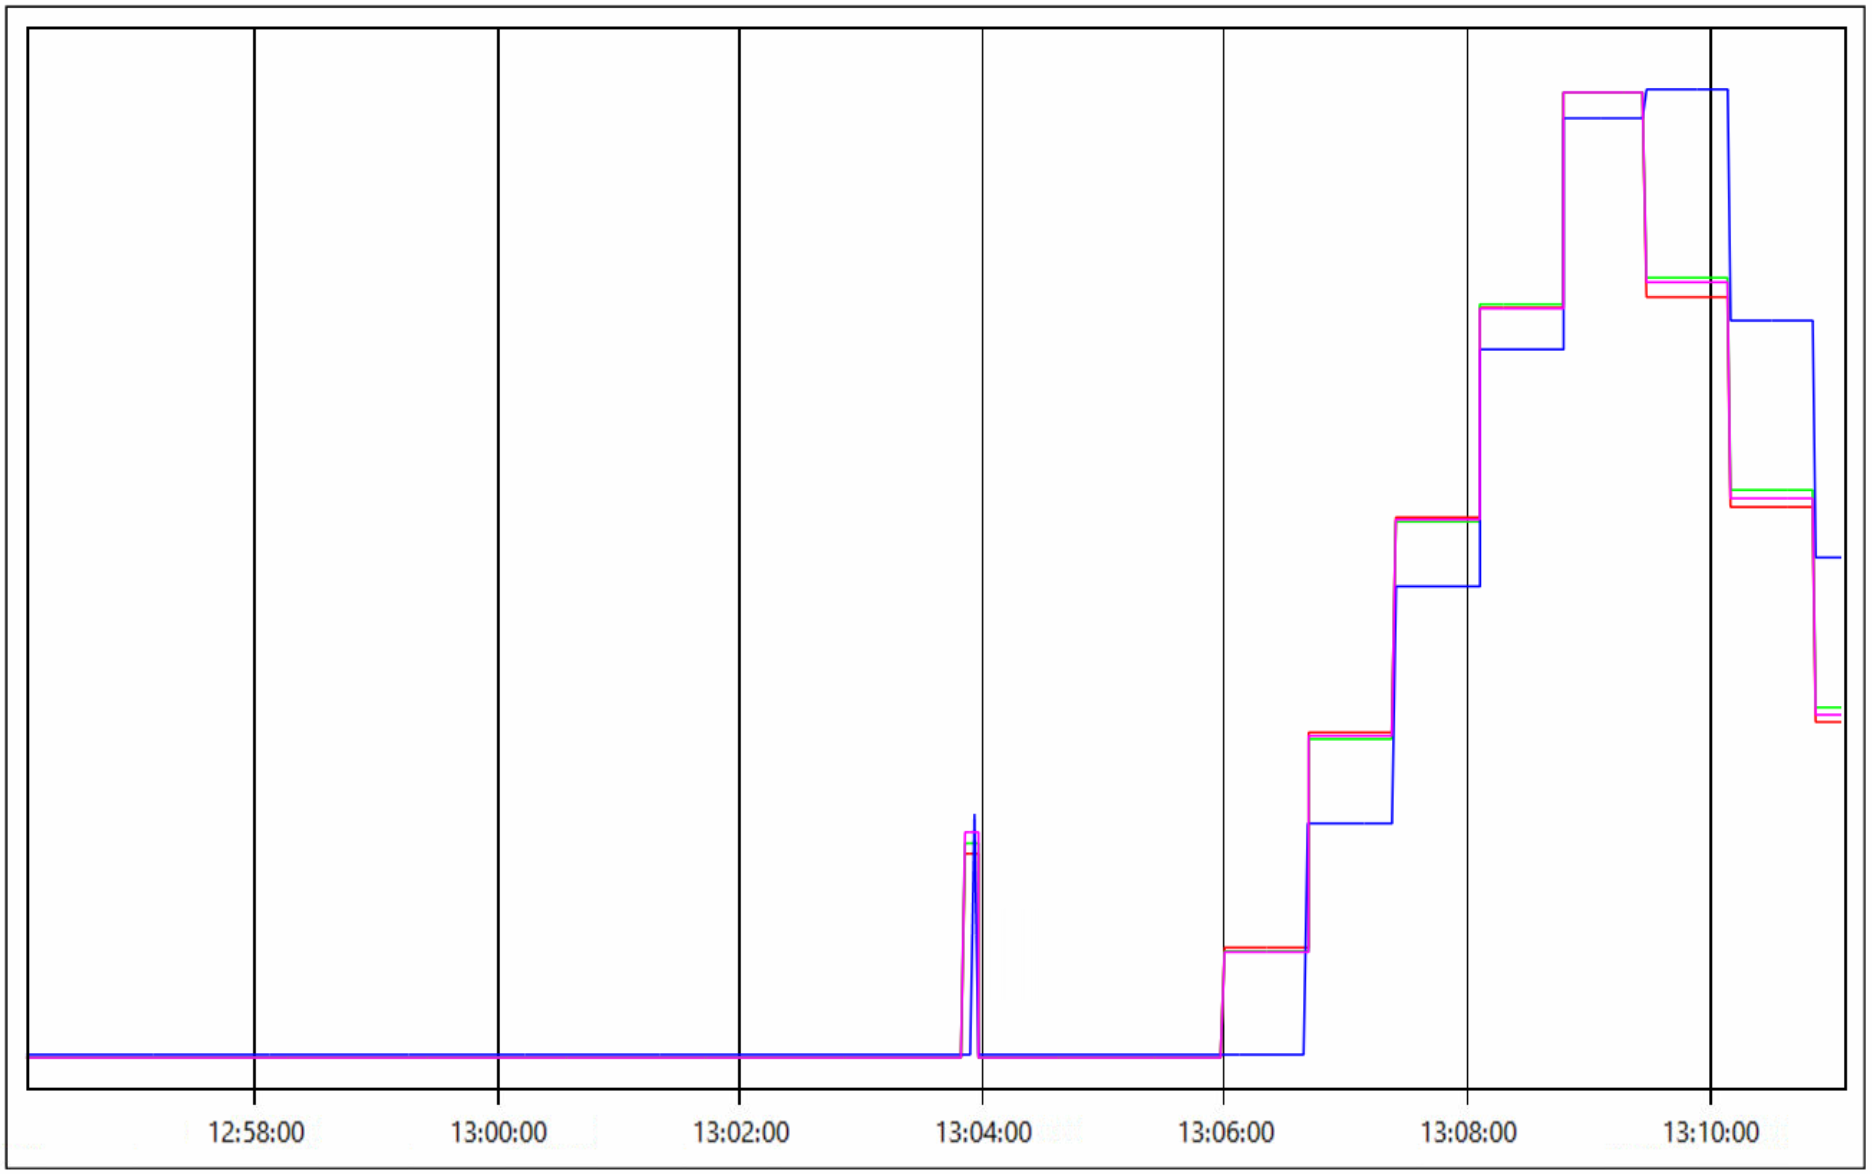
The TrendChart object adds a plot of the tag data to a View. Omniview also includes the TrendView, which is a general purpose utility for observing tag trends without requiring additional setup. See TrendView for information.
| Property |
Description |
| Background |
Background color of the chart |
| Border |
Border color of the chart |
| BorderThickness |
Border thickness in pixels |
| Cursors |
[Read Only] List of cursor objects. |
| End |
[Read Only] Read the end time covered by the chart in UTC time. |
| End_Time |
Set the End Time covered by the chart. Must be used with the Span property set. Start_Time must not be set and Track must be False. |
| Interval |
Used in the server request. The amount of history the client will request in milliseconds. |
| Selected |
[Read Only] Trends can be selected by clicking on their respective lines. Selected returns the |
| ShowStatus |
|
| Span |
Timespan covered by the chart. Format: hours:minutes:seconds
E.g. 1:00:00 days:hours:minutes:seconds
E.g. 30:00:00:00
|
| Start |
[Read Only] Read the start time covered by the chart in UTC time. |
| Start_Time |
Set the Start Time covered by the chart. Must be used with the Span property set. End_Time must not be set and Track must be False. |
| Track |
Automatically move the chart end time to the current time on view update. |
| Trends |
[Read Only] List of Trend objects. |
| Method |
Description |
| AddCursor(String) |
Adds a cursor to the plot. String is a user defined name. |
| AddTrend(String) |
Adds a trend to the plot. Function takes the target tag name as a string. |
| AddTrends(List[String]) |
Adds multiple trends to the chart. Function takes a list of tags names. |
| Export(String) |
|
| GetBase() |
|
| GetCursor(String) |
Returns a Cursor object by name. |
| GetTrend(String) |
Returns a Trend object by name. |
| RemoveCursor(String) |
Removes a cursor by name (key). |
| RemoveTrend(String) |
Removes a single trend from the TrendChart by name. |
| RemoveTrends(List[String]) |
Removes a list of trends from the TrendChart by name. |
| SelectTrends(List[String]) |
Selects trends on the TrendChart by name. |
| Event |
Description |
| SelectionChanged |
|
Trend Properties
| Property |
Description |
| ActualThickness |
|
| AutoFit |
Bool. Automatically sets the Min and Max values if they are unset. |
| Color |
Color of the trend line. Automatically set if not given |
| CursorValues |
[Read Only] Returns the current values of the trend line where it intersects a cursor. |
| IsSelected |
[Read Only] Returns true if the line is selected. |
| IsSteppedDisplay |
When false, additional values are interpolated between points to create smooth lines. |
| IsVisible |
|
| Name |
Name of the trend |
| Scale_Max |
Maximum Y value for this trend. |
| Scale_Min |
Minimum Y value for this trend. |
| SelectedThickness |
Line thickness when trend is selected. |
| Show_Points |
Shows raw data points. |
| Thickness |
Normal thickness of the trend line |
Cursor Properties
| Property |
Description |
| Color |
Color of the cursor |
| Horizontal_Line_Visible |
Toggles the horizontal cursor line visibility. |
| Key |
Name of the cursor. |
| Position |
Horizontal position of the cursor in pixels. |
| Timestamp |
Gets the time position of the cursor |
| Values |
Returns the cursor values. |
| Vertical_Line_Visible |
Toggles the vertical cursor line visibility. This is the main line. |
| Visible |
Toggles visibility of the cursor. |
| Width |
Width of the cursor line. |
View Example
{
    "$type":"TrendChart",
    "Name":"Chart1",
    "Height":"500",
    "Width":"800",
    "X":"0",
    "Y":"20",
    "BorderThickness":1,

    "ShwoStatus":"False",
    "Span":"00:15:00",
    "Track":"True",

    "Trends": [
        {
            "Name": "N7_12",
            "autofit": "true",
            "Color": "#FF0000"
        },
        {
            "Name": "N7_13",
            "autofit": "true",
            "Color": "#00FF00"
        },
        {
            "Name": "N7_14",
            "autofit": "true",
            "Color": "#0000FF"
        },
        {
            "Name": "N7_15",
            "autofit": "true",
            "Color": "#FF00FF"
        }
    ],
    "Cursors": []
}

Python Examples
from Omniview.Python import *

# Create Trend Chart
myTrendChart = TrendChart()
myTrendChart.X = 10
myTrendChart.Y = 100
myTrendChart.Width = 300
myTrendChart.Height = 200
myTrendChart.Track = True
myTrendChart.Span = TimeSpan(0,0,3,0,0)

# Add trends and cursors
myTrendChart.AddTrends(["N7_10","N7_11"])
myTrendChart.AddCursor("Cursor1")

# Configure trends
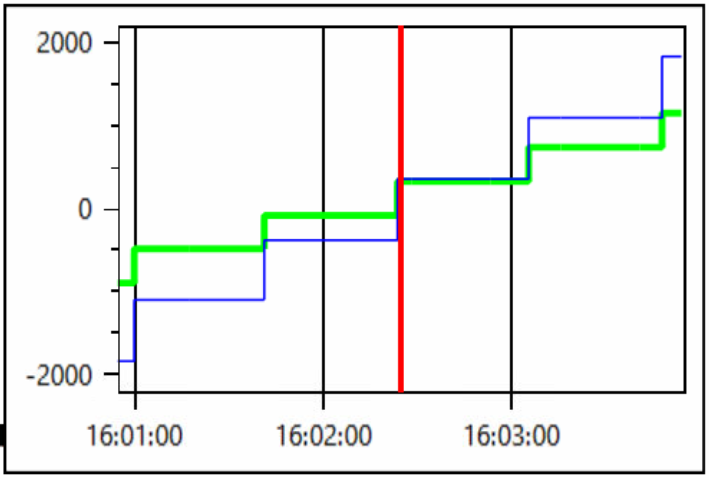
trend1 = myTrendChart.GetTrend("N7_10")
trend2 = myTrendChart.GetTrend("N7_11")

trend1.Scale_Max = 2000
trend1.Scale_Min = -2000
trend1.Thickness = 1
trend1.SelectedThickness = 3
trend1.Show_Points = False
trend1.IsSteppedDisplay = True
trend1.Color = Color("#00FF00")

trend2.Color = Color("#0000FF")

# Configure Cursor
cursor1 = myTrendChart.GetCursor("Cursor1")
cursor1.Color = Color("#FF0000")
cursor1.Width = 2
cursor1.Horizontal_Line_Visible = True
cursor1.Vertical_Line_Visible = True

Omniview.Windows[0].Content.AddViewObject(myTrendChart)

See Also
TrendView
Views
View Object Overview

